Indicators
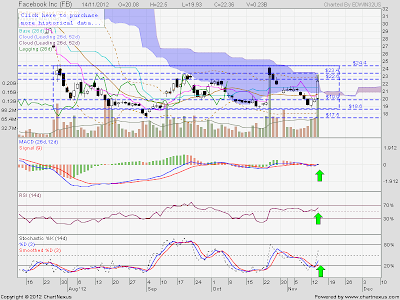
1 ) Trendline - In the sideway trendline between 18.6 to 24.4 . If break up from the 24.4 will indicate bullish.
2) Support/Resistance - Formed double bottom at 18.6 ( Slightly Bullish )
2) Support/Resistance - Formed double bottom at 18.6 ( Slightly Bullish )
3) MACD -Bullish Crossover and formed 4R1G ( Bullish ) .
4) RSI - Rebound from 50% and trending upwards (Bullish ) ,
4) RSI - Rebound from 50% and trending upwards (Bullish ) ,
5) STO - Rebound from 20% and bullish crossover (Bullish )
6) Ichimoku - a) Price entering from the support cloud (Slightly Bullish). If break above it will be bullish confirmation
6) Ichimoku - a) Price entering from the support cloud (Slightly Bullish). If break above it will be bullish confirmation
b) Conversion line below the base line (Bearish).
c) Price close above the baseline ( Bullish ) .
7) Candlestick pattern - White Candle after a bullish harami (Bullish ).
c) Price close above the baseline ( Bullish ) .
7) Candlestick pattern - White Candle after a bullish harami (Bullish ).
Conclusion
Bullish
If it can break away from the Support cloud and from the sideway trendline above 24.4 it will become more bullish..
Entry Price at 24.6
Stop Loss at 23
Profit at 25.5
E ( Entry) :24.6 ( Closed at or above it)
S ( Stop Loss) : 23
P ( Profit) :25.5
RRR (Risk to Reward Ratio) =0.56 (Risky)
E ( Entry) :24.6 ( Closed at or above it)
S ( Stop Loss) : 23
P ( Profit) :26.5
RRR (Risk to Reward Ratio) =1.19 (Average)
E ( Entry) :24.6 ( Closed at or above it)
S ( Stop Loss) : 23
P ( Profit) :29
RRR (Risk to Reward Ratio) =2.75 (Slightly Rewarding)
Resistance at 22.6 / 23.4 / 24.4 / 25.7 / 26.7 / 29.4
Support at 19/ 18.6 / 17.5 


0 comments:
Speak up your mind
Tell us what you're thinking... !